How New Blockchain Apps Make It Easier To Use DeFi
June 25, 2021
This article was written in close collaboration with Beneath, a blockchain data analytics service.
Dai went live on the Ethereum Mainnet in December 2017. Since then, it has kept a stable peg against USD as the price of Ether fluctuated by more than 94%. Today, more than 1.5% of all Ether is locked up as collateral in support of Dai.
When we announced the launch of Dai 13 months ago, we promised it would “enable the ecosystem to approach a new age of usability”. We are happy to say that we are delivering on that promise. In this post, we want to show you how Dai is actually used.
The information in this post is based exclusively on analysis of public transactions observed on the blockchain. As it uses Ethereum public addresses to differentiate between users, you should beware that some users may command multiple addresses.

Dai has real and growing adoption. There are nearly 8,200 unique addresses with a non-negligible Dai balance, and in January, we saw more than 7,300 active addresses sending or receiving Dai. On average, we observe 20% monthly growth in both holders and active addresses. Since the inception of Dai, roughly 19,600 unique addresses have or have had a balance of more than 1 Dai. Compared against the current number of holders, this implies a retention rate of 42% over the lifetime of the protocol.
Blockchain data is messy and if these numbers don’t match what you see elsewhere, it’s because we have made a serious effort to report clean data. Amongst other things, we correct for proxies and smart contracts that only temporarily hold Dai, and exclude addresses with less than 1 Dai. Using carefully cleaned data is important — had we taken the data at face value, we would be reporting 13,800 current Dai holders instead of 8,200.
There is currently 76 million Dai in circulation, which is approaching a new all-time high. While it tends to decline on occasions where the price of Ether dives to a new low (causing CDP liquidations), it has nevertheless also grown with an average rate of approximately 20% per month since the launch of Dai.
They teach you always to have charts that go up and to the right. Now that that’s out of the way, let’s take a deeper look at what people do with Dai.
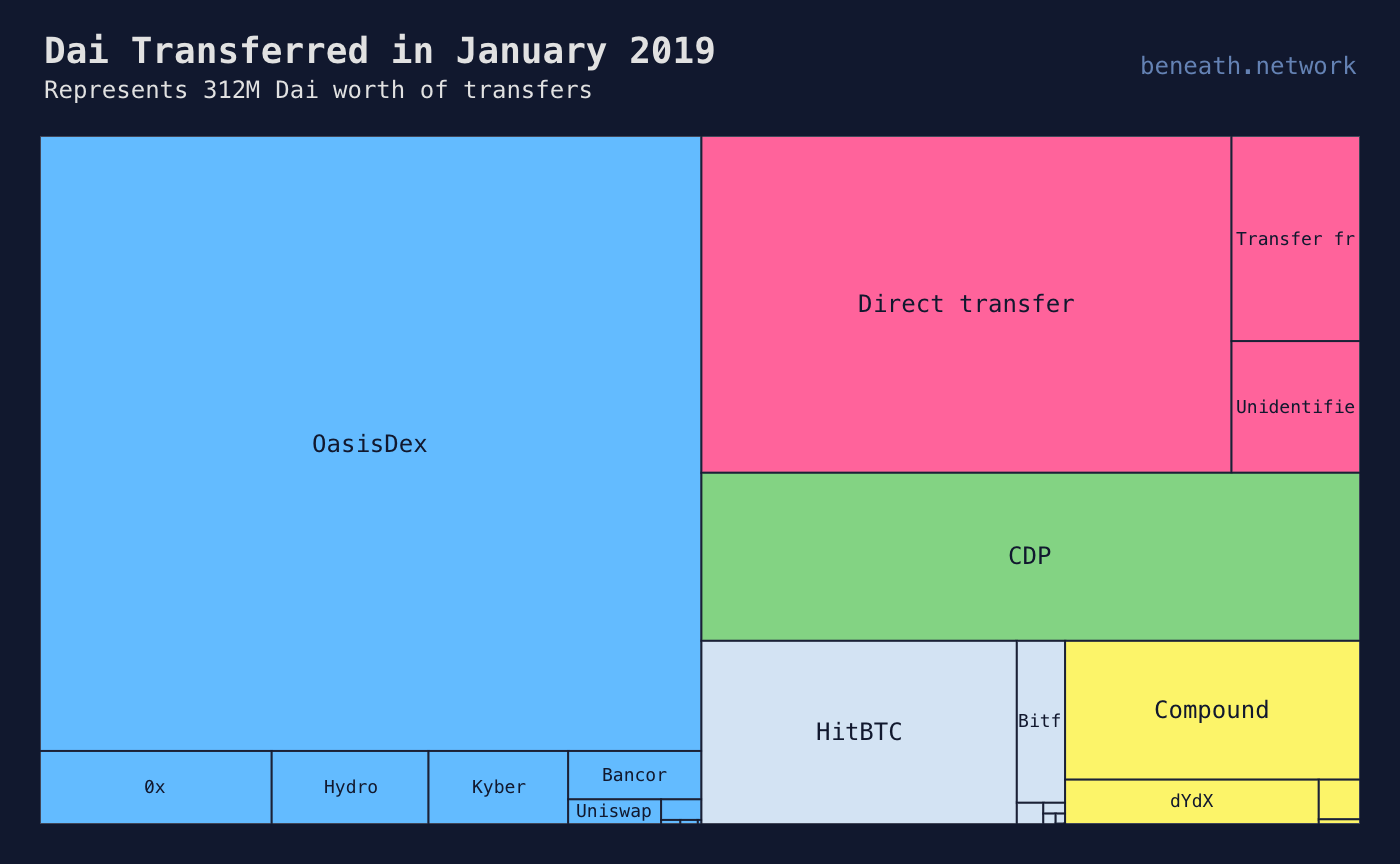
The figure above illustrates the total volume of Dai transferred in January and provides us with detailed insight into the Dai economy. It represents 312 million Dai worth of transfers (after cleaning the data as described above). Take a moment to study the figure yourself. Here are our key conclusions:
We are enthusiastic about the diversity of use cases that benefit from Dai and cannot wait to see this map grow even more diverse.
In the next section, we will take a closer look at the behavior of new Dai holders. But for the savvy in the audience, we want to briefly share some details on how we label Dai transfers. It is a multi-step process. First, we demask proxied transactions to reveal the true senders and receivers. We then attempt to match sender or receiver to known Ethereum addresses, such as those of exchanges. Failing that we fall back to searching the transaction call trace for known dapps. In the case of multiple matches, we apply the label of the first known dapp in the call trace.
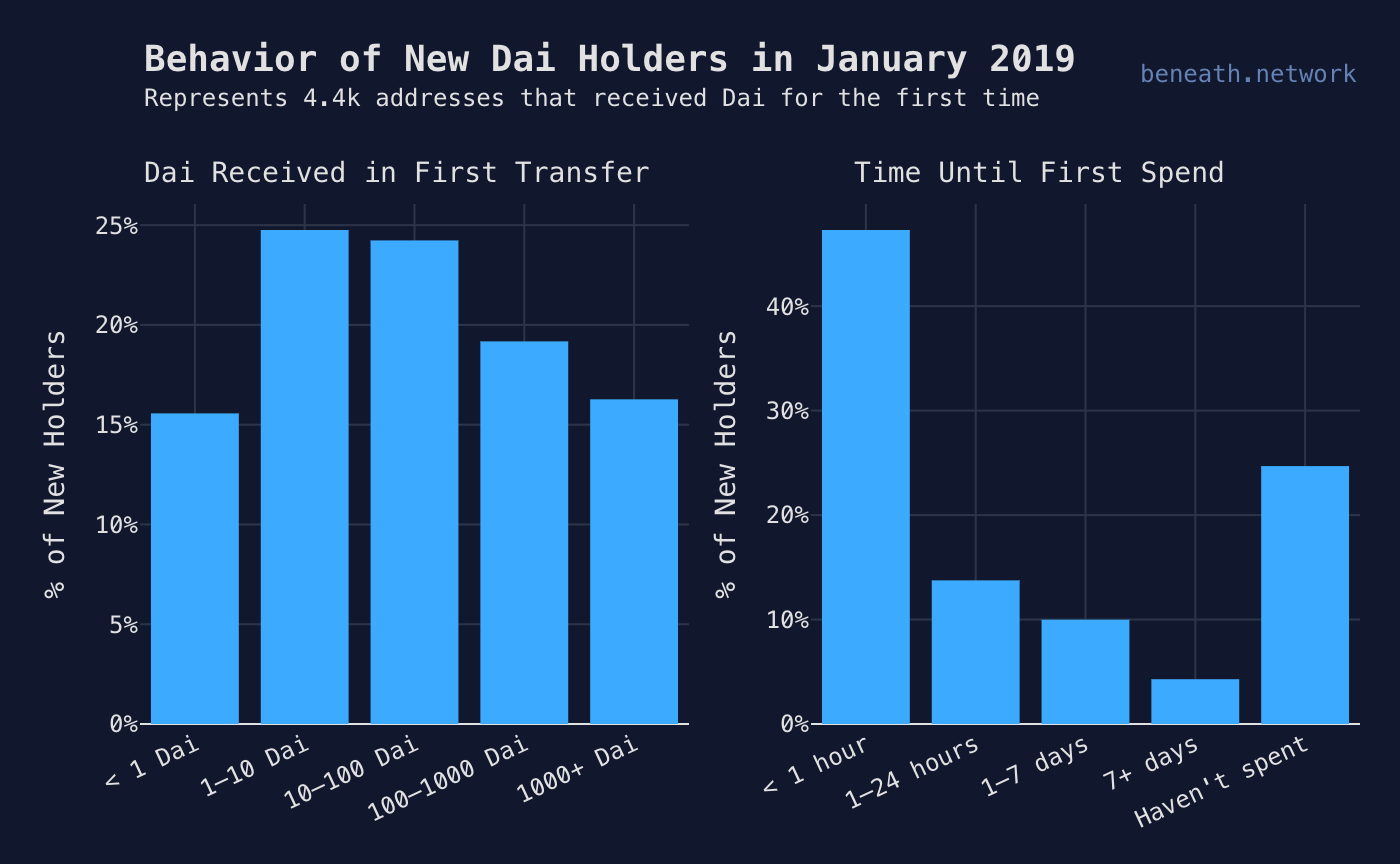
In January 2019 alone, some 4,400 addresses acquired Dai for the first time. The figure above zooms in on the behavior of this group.
The chart to the left shows how much Dai addresses receive in their very first incoming transfer. It’s no surprise that many receive fairly small amounts to begin with — after all, they may have only just heard about Dai. We suspect the 15% that receive less than one Dai to be a mixture of small test transfers and fees paid out as part of bigger transactions to decentralised applications.
We are thrilled to see that 16% of new addresses start out heavy by receiving more than 1,000 Dai. While a share of these are likely to be wallet migrations, we also see it as an indicator that a significant number of new users trust Dai with considerable amounts of money.
The chart to the right shows how much time that passes until a new Dai holder first spends Dai. 71% spend Dai within the first week,underscoring the fact that Dai is about usage, not speculation. It’s interesting that 25% appear to hodl Dai despite receiving no interest rate. While it may be due to the fact that some of them have not had the opportunity to spend it yet, we observe a roughly similar pattern going back in time as well. We’ll be keeping an eye on this behavior when we launch Savings Dai.
The next figure shows how the new holders in January got their first Dai. These transfers only cover 3.8% of the total Dai transferred in January, but it says a lot about users’ first experience with Dai. We like to view these as theDai onboarding channels.
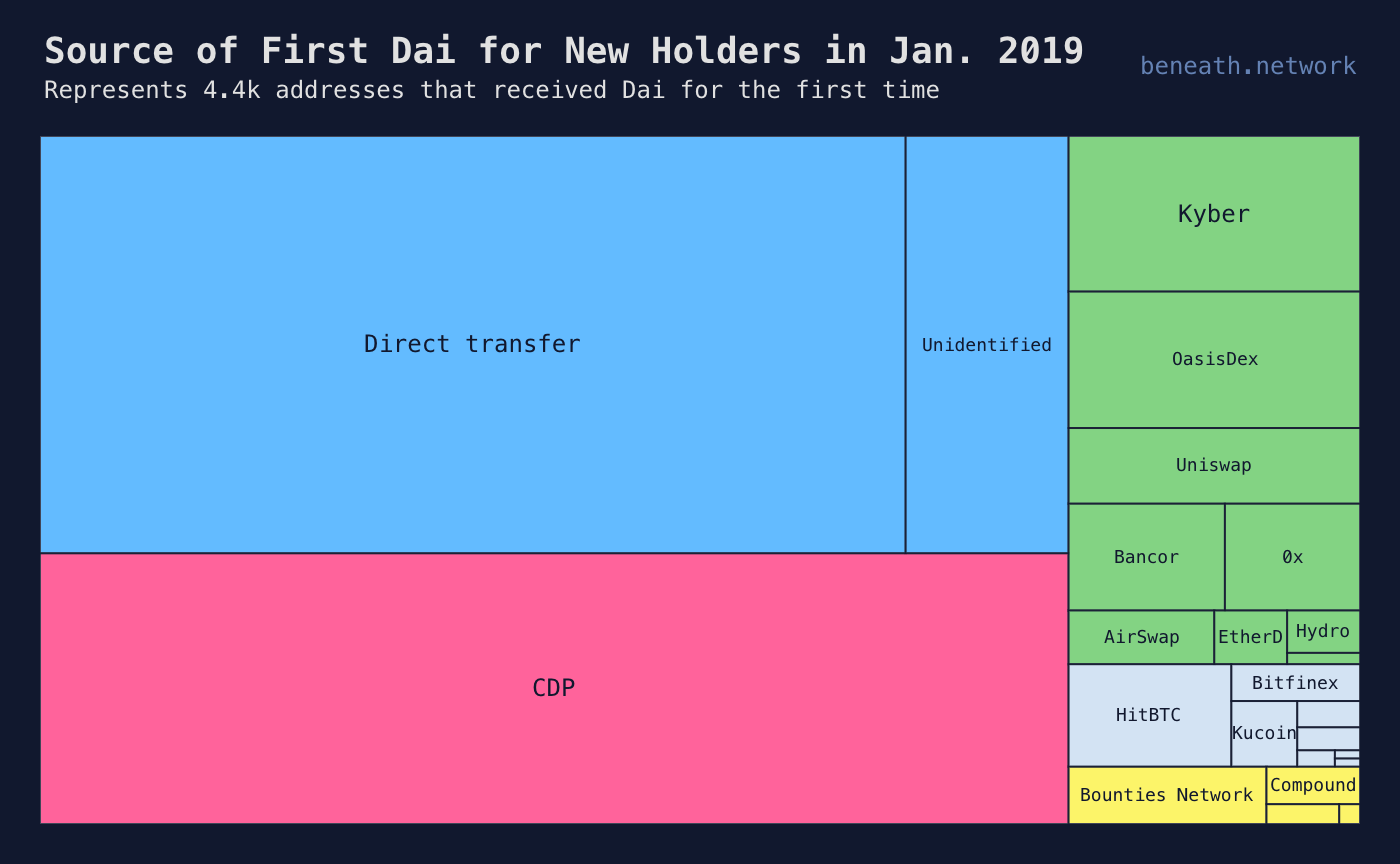
The most important channel for new Dai addresses is direct transfer, i.e., users taking payment, receiving gifts, migrating wallets or similar. Decentralised exchanges are significantly more common channels than centralised exchanges accounting for 17% of new holders. It’s very satisfying to see a whole 30% obtain their first Dai via CDPs, indicating that a significant number of users understand how the mechanism works.
Interestingly, The Bounties Network (which powers Gitcoin) was the first source of Dai for 1.3% of new holders despite representing only 0.02% of total Dai volume. This demonstrates the potential of dapps to act as onboarding channels to the decentralised economy. It’s important to remember that even though 0.02% of volume might not seem like much, it actually represents 67,000 Dai worth of transfers in January alone.
We are happy to see so many new addresses acquire Dai. In the next section, we take a closer look at the flipside — addresses that exit Dai.
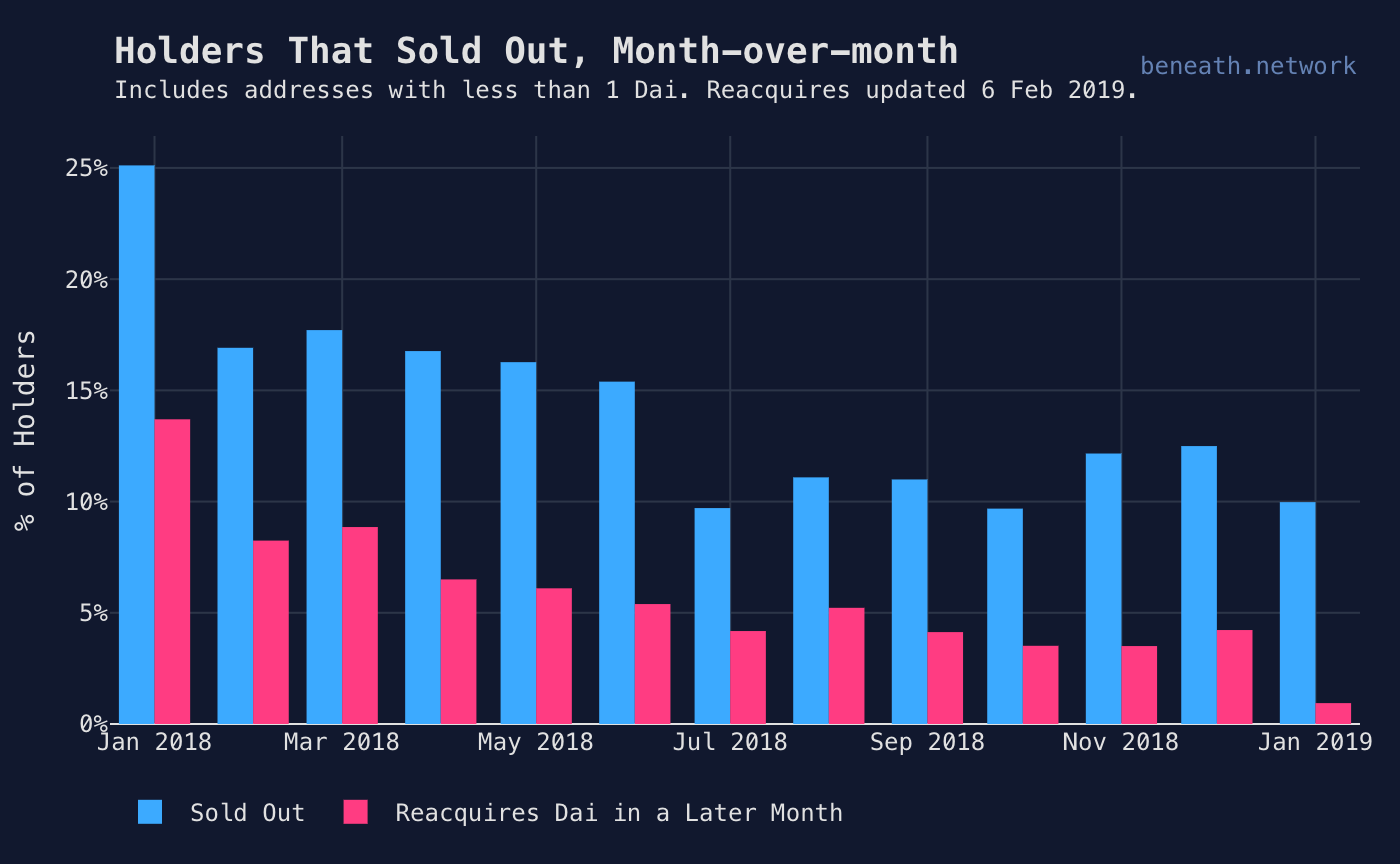
There has never been a month with a net decline in the number of Dai holders. Nevertheless, it is inevitable that some addresses churn, i.e., get rid of their Dai.
There’s many ways of looking at Dai churn. We are most interested in the exit of long-term holders, which is why the figure above only shows loss of addresses that were present the month before. On average, 11% of Dai holders at the end of one month will have little or no Dai at the end of the next month. However, historically a little less than half of these will reacquire Dai in a later month. Factoring this gives us an effective churn rate of about 6%. We are not currently able to distinguish wallet migrations from lost users, but this at least provides an upper limit on the loss of users.
That concludes our study of what addresses do with Dai. Before we wrap up, we will take a change of perspective and look at usage from the viewpoint of Dai itself.
New Dai is created when people create CDPs and withdraw Dai. Once created, Dai is fungible as there is no difference between Dai collateralized by different CDPs. It is like taking out any other loan — you’re expected to pay it back, but it’s very unlikely you will be paying it back with exactly the same cash. This means that Dai, once created, can go on a long and winding journey through changing addresses, all the while generating economic activity.
Even though Dai is fungible, we can differentiate between Dai by taking a first-in-first-out (FIFO) view of Dai balances. That’s like viewing each Dai as a separate note with an issuance date printed on. Now, let’s do some statistics on the history of the “notes” that people have paid when they close CDPs.
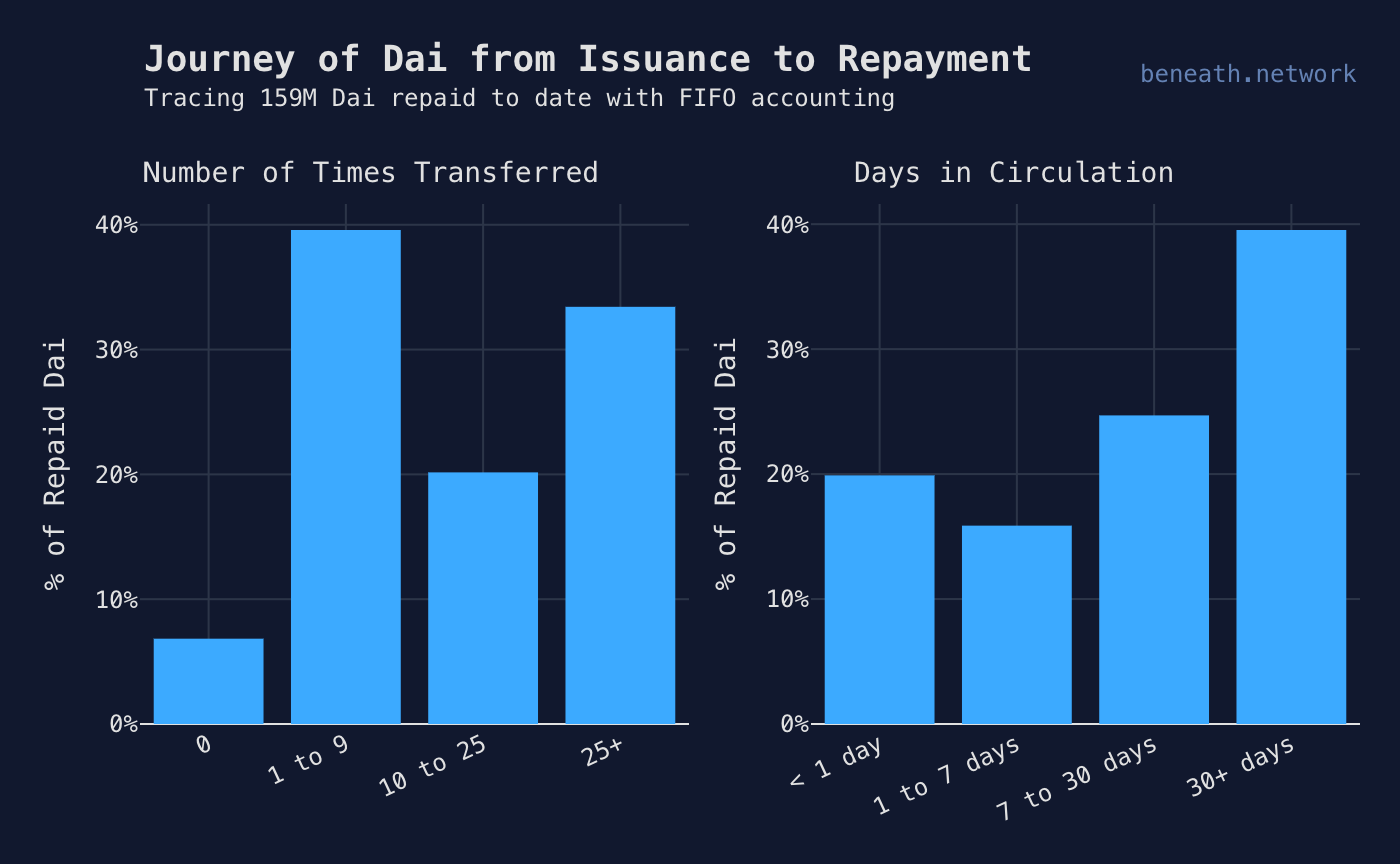
We get a picture of the journey Dai passes through from issuance to payback. On average, a Dai will be in circulation for nearly a month and will change owners 10 times before being removed from circulation. Additionally, 40% of Dai stays in circulation for more than a month and 33% of Dai is transferred more than two dozen times.
The charts above hide the fact that these distributions have a long tail. In fact, some Dai recently repaid had been transferred nearly 500 times. In contrast, at the lower end of the distributions, some 7% of Dai is paid back without ever having been transferred, and 20% is paid back on the first day. Our best guess is that these represent a mixture of test loans, leftover liquidity that is never spent, and short-term market making.
Dai is helping facilitate adoption and real usage of decentralised applications. On all of the basic indicators — holders, active users and Dai in circulation — it is growing at an average monthly rate of 20%. It has high retention and is servicing an increasingly diverse set of use cases, including decentralised exchanges, payments, lending and decentralised bounties. There are several significant channels through which new users acquire their first Dai, and significantly more addresses are buying into the ecosystem than leaving it. Newly issued Dai will on average change hands dozens of times before being paid back, generating economic activity an order of magnitude greater than its nominal value. Here’s to the next year of Dai.